Introduction :
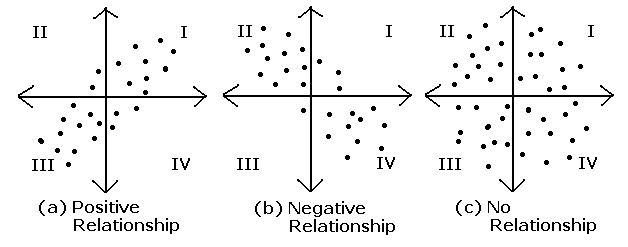
Covariance and Correlation are two mathematical concepts which are quite commonly used in statistics. When comparing data samples from different populations, Both of these two determine the relationship and measures the dependency between two random variables. Covariance and correlation show that variables can have a positive relationship, a negative relationship, or no relationship at all.
A sample is a randomly chosen selection of elements from an underlying population. We calculate covariance and correlation on samples rather than complete population. Covariance and Correlation measured on samples are known as sample covariance and sample correlation.
Sample Covariance :
Covariance measures the extent to which the relationship between two variables is linear. The sign of the covariance shows the trend in the linear relationship between the variables, i.e if they tend to move together or in separate directions. A positive sign indicates that the variables are directly related, i.e. when one increases the other one also increases. A negative sign indicates that the variables are inversely related, so that when one increases the other decreases.
The sample covariance matrix is a K-by-K matrix ,


Here’s what each element in this equation means:
qj,k = the sample covariance between variables j and k.
N = the number of elements in both samples.
i = an index that assigns a number to each sample element, ranging from 1 to N.
xij = a single element in the sample for j.
xik = a single element in the sample for k.
Sample Correlation :
The sample correlation between two variables is a normalized version of the covariance.
The value of correlation coefficient is always between -1 and 1. Once we’ve normalized the metric to the -1 to 1 scale, we can make meaningful statements and compare correlations.
To calculate the sample correlation also known as sample correlation coefficient , between random variables X and Y, divide the sample covariance of X and Y by the product of the sample standard deviation of X and the sample standard deviation of Y.


The key terms in this formula are
Corr(X,Y) = sample correlation between X and Y
Cov(X,Y) = sample covariance between X and Y
![]()
![]()
![]()
![]()
The formula used to compute the sample correlation coefficient ensures that its value ranges between –1 and 1.
Implementation :
Numpy has provided methods to calculate these two stats given random variable as input.
Import libraries :
Covariance :
import os
import sys
import numpy as np
import matplotlib.pyplot as plt
import seaborn as sns
X = np.random.rand(50)
Y = 2 * X + np.random.normal(0, 0.1, 50)
cov_matrix = np.cov(X, Y)
print('Covariance of X and Y: %.2f'%cov_matrix[0, 1])
Output: Covariance of X and Y: 0.21
Correlation :
X = np.random.rand(50)
Y = 2 * X + np.random.normal(0, 0.1, 50)
cor_matrix = np.corrcoef(X, Y)
print(Correlation of X and Y: %.2f'%cor_matrix[0, 1])
Output: Correlation of X and Y: 0.99
Correlation vs. Covariance
Correlation is simply a normalized form of covariance. They are otherwise the same and are often used semi-interchangeably in everyday conversation. It is obviously important to be precise with language when discussing the two, but conceptually they are almost identical.
The value of cov ranges from [-1 – 1]. -1 stand for negative relationship. 1 means positive relationship. 0 means no relationship.
To get a sense of what correlated data looks like, lets plot two correlated datasets
Positive Relationship:
X = np.random.rand(50)
Y = X + np.random.normal(0, 0.1, 50)

plt.scatter(X,Y)
plt.xlabel('X Value')
plt.ylabel('Y Value')
plt.show()
print('Correlation of X and Y: %.2f'%np.corrcoef(X, Y)[0, 1])
Output: Correlation of X and Y: 0.94


Negative Relationship :
X = np.random.rand(50)
Y = -X + np.random.normal(0, .1, 50)

plt.scatter(X,Y)
plt.xlabel('X Value')
plt.ylabel('Y Value')
plt.show()
print('Correlation of X and Y: %.2f'%np.corrcoef(X, Y)[0, 1])
Output: Correlation of X and Y: -0.96


Conclusion :
The value of correlation coefficient ranges from -1 to +1 whereas the value of covariance lies between -∞ and +∞.
Covariance is affected by scale of the variables i.e. if you multiply the variables by some other constant then the value of covariance is changed. As against this, since correlation is normalized before the relation calculation not influenced by the change in scale.

